GIS FOR DISASTER RESPONSE
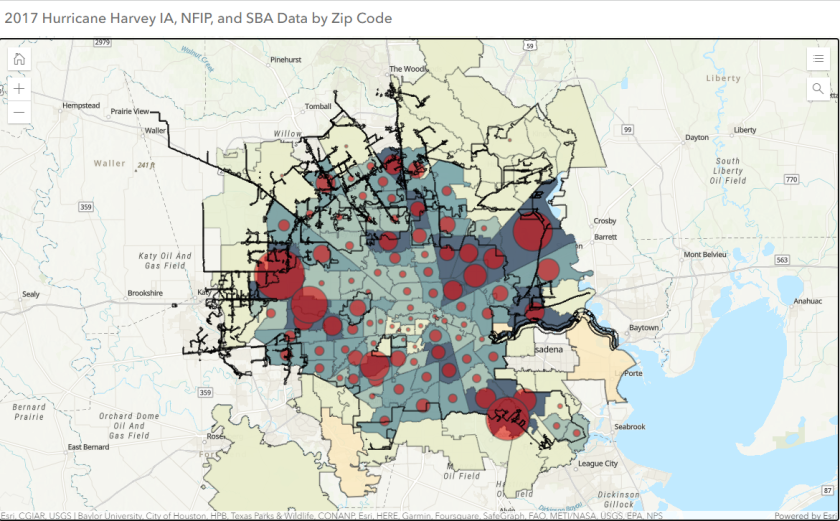
In Houston, Texas, GIS technology has played a significant role in disaster response. After Hurricane Harvey, the technology was an essential tool in obtaining the necessary funding to get Houstonians back into their homes, according to Arturo Tovar, GIS supervisor for the city’s Housing and Community Development Department (HCD). Tovar came to the city in November 2017, just months after Harvey’s August 2017 landfall.
The process was completed in two phases or tiers, the first being citywide and the second being site-specific. The first tier was developed in less than a year, and Tovar credits the work of the HCD GIS team in ensuring the city received the funding necessary for recovery efforts. It also helped the city make decisions about which populations would be served first in response efforts.
“GIS was a key factor within the department and in the process to get Houstonians back to their homes,” he said, underlining its power to expedite the process and assist Houstonians in getting reimbursed for what they paid for damages.

The Harvey response highlighted the value of GIS as a tool and integrated it into other processes. From better reporting of HCD’s work to expanding awareness of and access to affordable housing to other urban planning work, Tovar said, GIS work is in high demand for various applications — even among other city teams.
GIS IN WATER MANAGEMENT
In the state of Kansas, GIS tech has played a similar role in helping the state obtain funding necessary to serve constituents, but in this case, the work relates to water management.
The Kansas Water Office (KWO) is a small state agency that was established in 1981 with its main role being to create and implement the Kansas Water Plan, a document with hundreds of pages of information.
The plan is funded by the State Water Plan Fund, but it is very complex and requires the KWO to advocate for funding for various projects. These relate to a wide range of initiatives, from addressing harmful algal blooms and invasive species to irrigation to flooding.
“Anything that touches water at a state level in Kansas, the State Water Plan Fund helps implement,” said Katie Goff, KWO GIS coordinator.
KWO created a hub using ArcGIS Insights to replace the spreadsheets it previously used to track spending and needs. This took the static PDFs, sheets and maps and made the information interactive and user-friendly.

Although the hub is primarily used by state agencies whose work involves the State Water Plan Fund, such as the Department of Agriculture and the Department of Health and Environment, Goff has found that it has also proven impactful at the regional level, as it can be used to point to how specific programs or initiatives are impacting specific regions or counties. As counties invest money into the Fund, they want to see a return on their investment, which the GIS hub enables.
While other state agencies contribute data to this tool through KWO, Goff said the next step for the state will involve exploring ways to automate the process of gathering data from agency partners.
GIS IN WILDFIRE RESPONSE, MITIGATION
For some government entities, GIS tech enables greater environmental insights for planning that can help them better manage wildfires and related assets.
For the California Department of Transportation (Caltrans), GIS tech has proven helpful in wildfire response, explained Aaron Ott, chief of the Office of Data Services and Technology within Caltrans. The applications of GIS in this space are primarily for vulnerability assessments and asset management.
Where much of this work was once done with a pen and notepad, GIS technology now pairs with UAS photogrammetry and lidar technology to acquire data about assets. For example, if pavement is damaged on a bridge, Caltrans can make data-driven decisions to prioritize response efforts or make the public aware of road closures.
This was helpful in response efforts following the Camp Fire. These technologies paired together painted a picture for the Caltrans team to both assess, and deploy, efforts to address damage along the agency’s corridors.

Image courtesy of Caltrans.
Caltrans collaborates with the California Governor’s Office of Emergency Services, and Ott said the department is currently working to develop improved methods of data sharing to make important data available to those who need it.
The Utah Department of Natural Resources, meanwhile, uses GIS tech for mitigation efforts within the department’s Division of Forestry, Fire and State Lands (FFSL).
Gabriel Svobodny, senior GIS analyst with FFSL, explained that ArcGIS is used to understand the potential risk areas to the environment. Notably, the state applies AI technology to help with vegetation mapping. For wildfire prevention, this technology can help staff identify dead trees, as clusters of dead trees can be an indicator of increased wildfire risk.

Svobodny explained that while there are pre-trained AI models available for specific applications, he trained the AI from scratch to identify invasive tamarisk vegetation based on the color it displays in images — he noted that the barrier to entry for AI is not as high as one might think.
After certain invasive species have been identified and mapped, the department can use that information to prioritize decisions related to response work on the ground.
And while he acknowledged that this kind of technology has been used for a long time, the use has been ramping up recently, a trend he expects to continue as it not only provides a more accurate picture of vegetation, but it also helps to save time for staff.
“I think, essentially, this is the future of vegetation mapping; you need some combination of remote sensing, artificial intelligence and ground survey,” he stated.


