
The study focused on how easy it would be to use each state’s report card to compare student performance before and after the pandemic.
To find out, a team of six reviewers — one education professor, one CRPE project manager, three education researchers and one education writer — analyzed each state report card, looking for longitudinal data on student achievement levels in English language arts (ELA) and mathematics, science and social studies; achievement growth in ELA and mathematics; chronic absenteeism; high school graduation rate; and English learner proficiency or growth. The reviewers then rated the accessibility of these data sets on a four-point scale.
Dr. Morgan Polikoff, a professor at the University of Southern California Rossier School of Education who led the study, said longitudinal data on these indicators was hard to find on a large number of state report card sites, and that most of them are challenging to navigate.
“I think what the project illustrates is that state report cards are not particularly useful to answer fundamental questions about how schools are doing,” Polikoff said. “There needs to be some serious attention paid to these report cards to rethink how they present information so that they’re usable by the intended audiences.”
Designed to keep the public posted on a wide range of school and student performance metrics, state report cards must be prepared and disseminated annually, according to the Every Student Succeeds Act (ESSA). The law requires state report cards to include data from all state and local educational agencies that receive Title I funds.
“I would say in a lot of these states it’s not clear to me that they serve any real purpose other than a compliance checkbox,” Polikoff said. “I think if they were better designed, they could serve many useful purposes, especially for parents.”
Families need access to comprehensible school and student performance data to make informed decisions, Polikoff said, pointing to the rise in school choice options and the fact that “schooling is becoming increasingly decoupled from where you happen to live.”
Along with offering a clear view of how schools compare, Polikoff said he believes state report cards should also make it easy to see student performance data over time, as that would give the public a better understanding of academic recovery in the wake of COVID-19.
“We have lots of suggestive evidence that parents don’t understand the magnitude of the COVID-19 downturns in achievement or attendance, or at least aren’t as concerned as experts think they should be,” the CRPE report states.
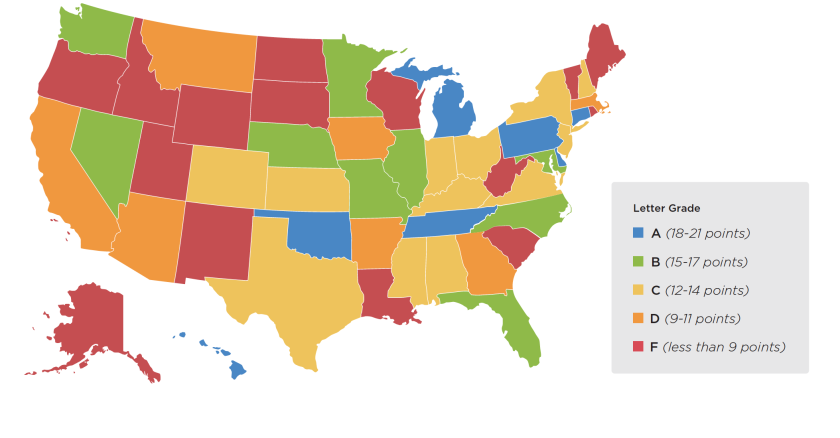
The study shows only seven states received an A for the longitudinal student performance data found in their report cards. Of those, only Oklahoma received a top grade for usability too. In other words, while some states did include longitudinal data, it was often too difficult for the average user to find.
The opposite was true in other states, where report card websites were easier to use but did not provide the data or features necessary to make comparisons over time. New Mexico, for example, was one of five states that earned an A for usability — and one of 13 that got an F for lack of access to longitudinal data.
“Once you spend time on a few of these websites, it becomes very clear that they have lots of problems and also that they vary tremendously along every conceivable dimension,” Polikoff said. “I actually do expect that a number of the states will revise their report cards as a result of this report, if not that it inspires some legislation.”
The language of the ESSA law sets minimum requirements for which metrics must appear on each state’s report card, such as measures of student achievement, chronic absenteeism, teacher experience, incidents of violence and spending per pupil, among others. However, ESSA does not make specific requirements about the design of the report cards, stating only that they must be “presented in an understandable and uniform format that is developed in consultation with parents and, to the extent practicable, in a language that parents can understand.”
Polikoff said CRPE's report is “really resonating,” as evidenced by the number of conversations he’s been having with state officials since it was issued last week. He said he’ll be meeting with a member of the U.S. Senate Committee on Health, Education, Labor and Pensions next week to discuss moves to improve these report cards.
“A lot of them are really bad, are very close to useless,” Polikoff said. “I’m hopeful that, you know, under a new administration, there would be a push to improve the quality of state report cards and the quality of data that’s provided to parents.”
