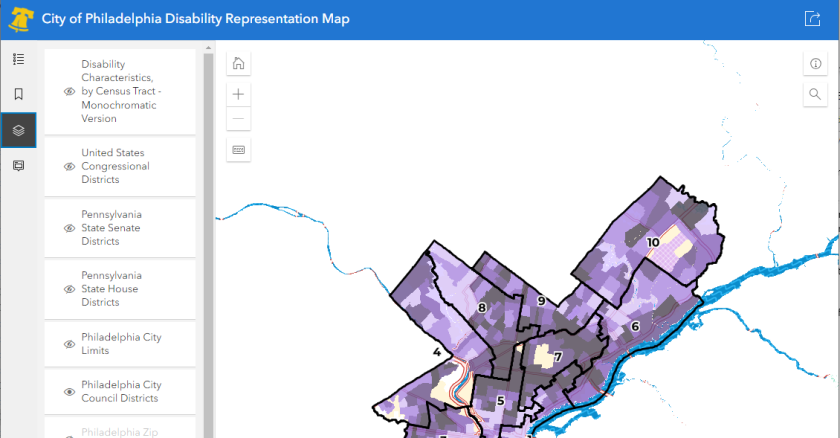
The first publicly accessible iteration of the map, called the Philadelphia Disability Characteristics Map, was rolled out in 2022 with limited demographic data and limited accessibility. When Esri released the accessible base layer for their products, Amy Nieves, executive director for the Mayor’s Office for People with Disabilities (MOPD), and Dan Warner, the city’s Office of the City Commissioners’ lead GIS analyst, worked together to improve the map with this feature so it can be more widely used. This new map not only aims to be a tool for decision-makers, but also, it is intentionally designed to be accessible for use by people with different abilities.
Philadelphia has the highest rate of disability for large U.S. cities at about 16 percent, a measure Nieves thinks may be inaccurately low due to the inaccessible census count process. Now the map helps better represent the diverse range in abilities of city residents.
The map was first created in 2019 to assist Philly Counts with strategic planning and has since undergone some major improvements. The 2022 relaunch was created through a partnership between MOPD and Philly Counts. Then, in 2023, the overhaul for accessibility was achieved through a partnership between MOPD, the U.S. Access Board and Esri.
The map uses data from the U.S. Census Bureau’s American Community Survey to show where people with one or more disabilities live in the city. The Office of Information Technology’s CityGeo team also offered support, particularly in the accessibility rollout, Nieves said.
The map — created using ArcGIS Online, ArcGIS Pro, ArcGIS Instant Apps and ArcGIS Living Atlas — will be updated when new tables are released by the US Census Bureau.
“I do think that this is the map that's going to change our nation [in terms] of how we look at data,” Nieves said.
Having a clear understanding of where people with disabilities live within the city helps inform the city’s decision-making in areas such as creation of the Office of Emergency Management’s hazard mitigation plan.
The city faced several major catastrophic events this year — a highway collapse, a chemical spill and air quality concerns — and Nieves underlined how the map can help in such cases to determine how the city can better mobilize or evacuate or distribute resources as needed.
“It’s also shifting how we think about bringing our equity work into action,” said Nieves.
One example of this shift is the way that this map may help inform the deployment of grants. Last year, grant funding supported a project to bring a mobile library unit to neighborhoods, and this map was used in the proposal. It also helped determine which neighborhoods to prioritize in a project increasing the accessibility of emergency management broadcast videos with American Sign Language.
Not only was this tool created with the community it is representing in mind, but the city also worked with a community review team made up of people with different types of disabilities, backgrounds and levels of technology access.
The map’s relaunch includes additional navigation options for accessibility — including textures in a monochromatic layer for people with monochromatic or low vision, and keyboard navigation — as well as outlining the data in narrative form. According to Nieves, the narrative format lets people read, or hear, the story of the people living in these neighborhoods.
Not only does this feature help people with low data literacy, but it also helps people who use a screen reader due to dyslexia, low vision, blindness or other disabilities. The information will be read to users using AI technology to bring the data story to life.
“We did narrative format so that you're being told the story,” Nieves said. “And you're having this dialogue with the data where I think it really brings forward the humanity of the map.”
When it comes to the story that data tells, context is key, which is why users of the map will first see acknowledgments that Philadelphia’s land is part of the ancestral homelands of the Lenape peoples and that the U.S. Census Bureau’s American Community Survey uses language that may be antiquated.
For example, the survey only allows respondents to identify with male and female genders and does not include nonbinary, intersex or gender-nonconforming data. It also only includes six options for race, one of which is “some other race,” so Nieves argued there is a need for the Census Bureau to improve its data collection process.
Nieves noted that the map has been used in the process for advancing her legislative requests for a change to the Philadelphia Home Rule Charter to make the work of MOPD permanent through future administration changes with the creation of an Office for People with Disabilities. This map helped make her case for why this population within Philadelphia deserves support from the city in the form of a permanent office.
This issue will be up for a vote Nov. 7, 2023. And for people with disabilities, advocates and other stakeholders, this map can help empower them to advocate for this issue to decision-makers.
“Everything we do as a city should be accessible to people with disabilities and should be inclusive of them,” said Josie Pickens, chief of the city’s Office of Diversity, Equity and Inclusion, during a press conference. “That’s what makes this map so innovative.”